Raible's Wiki
Raible Designs
Wiki Home
News
Recent Changes
AppFuse
Homepage- Korean
- Chinese
- Italian
- Japanese
QuickStart Guide
- Chinese
- French
- German
- Italian
- Korean
- Portuguese
- Spanish
- Japanese
User Guide
- Korean
- Chinese
Tutorials
- Chinese
- German
- Italian
- Korean
- Portuguese
- Spanish
Other Applications
Struts ResumeSecurity Example
Struts Menu
UserPreferences
Referenced by
Articles
Articles_de
Articles_pt
![[RSS]](https://raibledesigns.com/wiki/images/xml.png "Aggregate the RSS feed")

Hide Menu
AppFuseDebug |
|
| Your trail: | |
A debugger is one of the most powerful tools in a developers toolkit. This tutorial goes over how a user can run an AppFuse based web application and associated test cases under a debugger.
In this tutorial I show screentshots of debugging an Appfuse based project using IntelliJ IDEA but the same can be done using most Java IDE's including Eclipse.
Table of Contents
- [1] Open project using an IDE
- [2] Running Test Cases in a debugger
- [3] Running your web application under Tomcat in a debugger
Open project using an IDE [#1]
Open your project using IDEA or Eclipse. There are several HowTos on this available on the AppFuse page.Here's a quick reference
- How I setup my Development Environment.
- Developing your AppFuse application in Eclipse.
Running Test Cases in a debugger [#2]
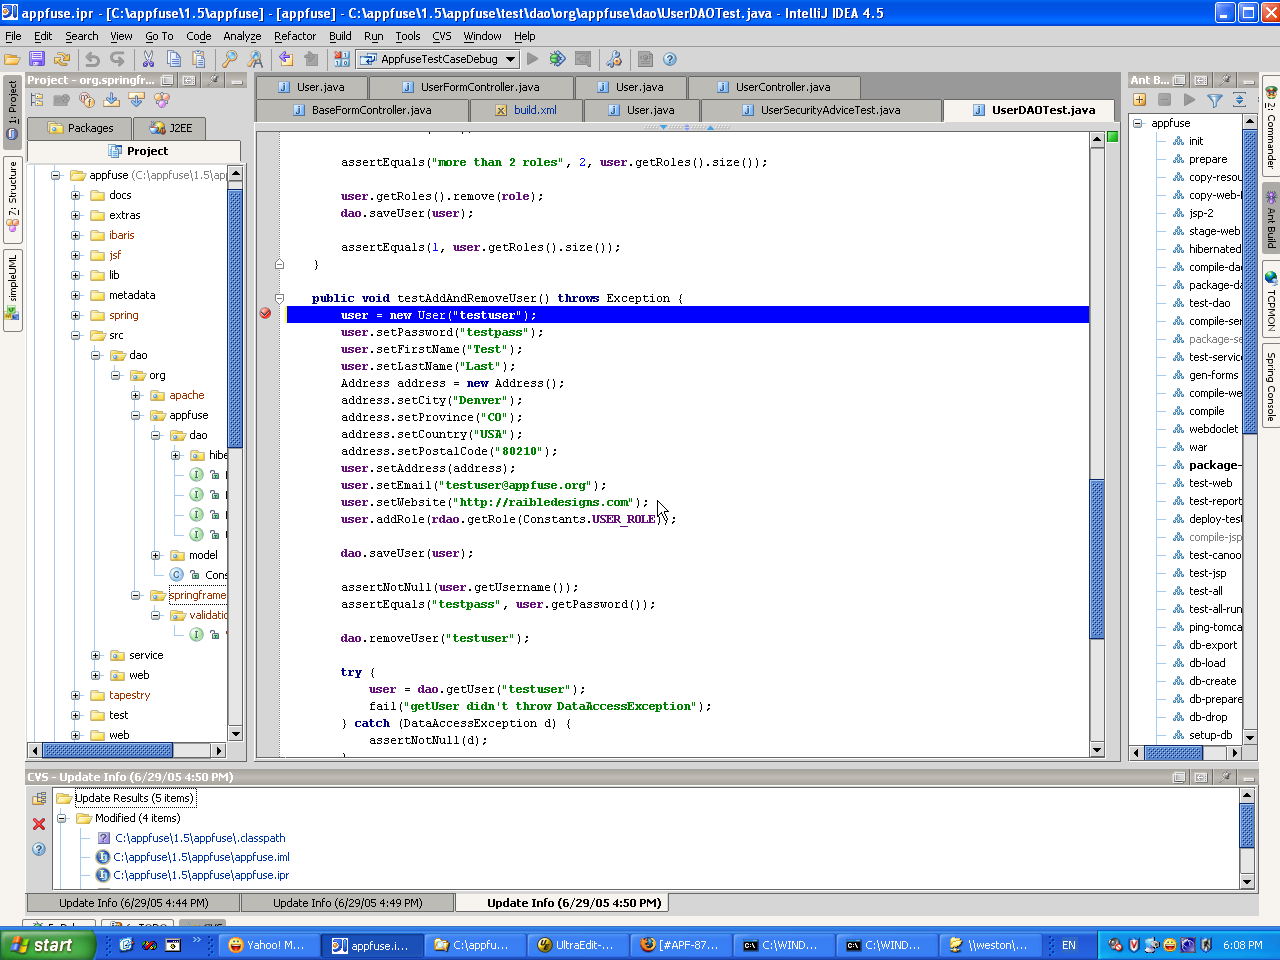
- In your IDE, set breakpoints at the appropriate locations in your code
- Now run your test targets as usual however pass an additional system parameter in the format -Dprojectname-debug=true.
The sample project here is named "foo" so I run ant -Dfoo-debug=true test-dao as shown below.
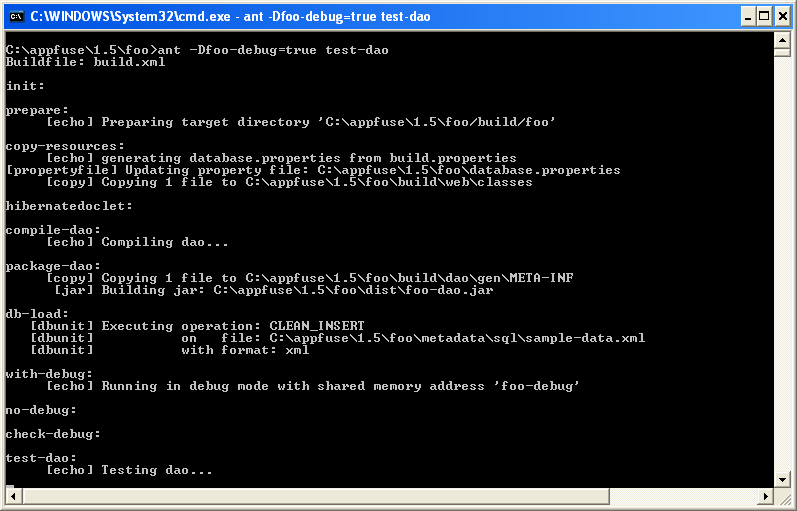
- This runs the java process in debug mode with shrared memory address projectname-debug which would be foo-debug in this case.
The JVM suspends at this point waiting for you to connect to the java process via a remote debugger.
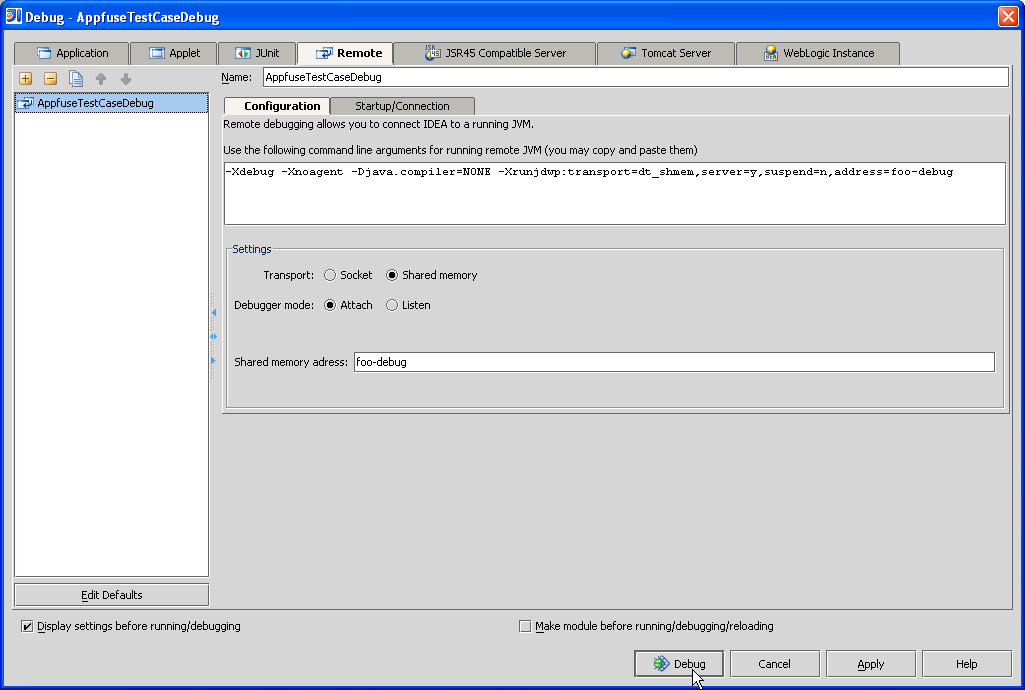
UPDATE 1/13/06 : Since Eclipse does not support debugging using shared memory, AppFuse has been updated to run using Socket debug mode which listens on port 4000
The screenshot below illustrates how this is done in IDEA.
- After connecting to the remote process, the java application resumes until a breakpoint in your code is hit.
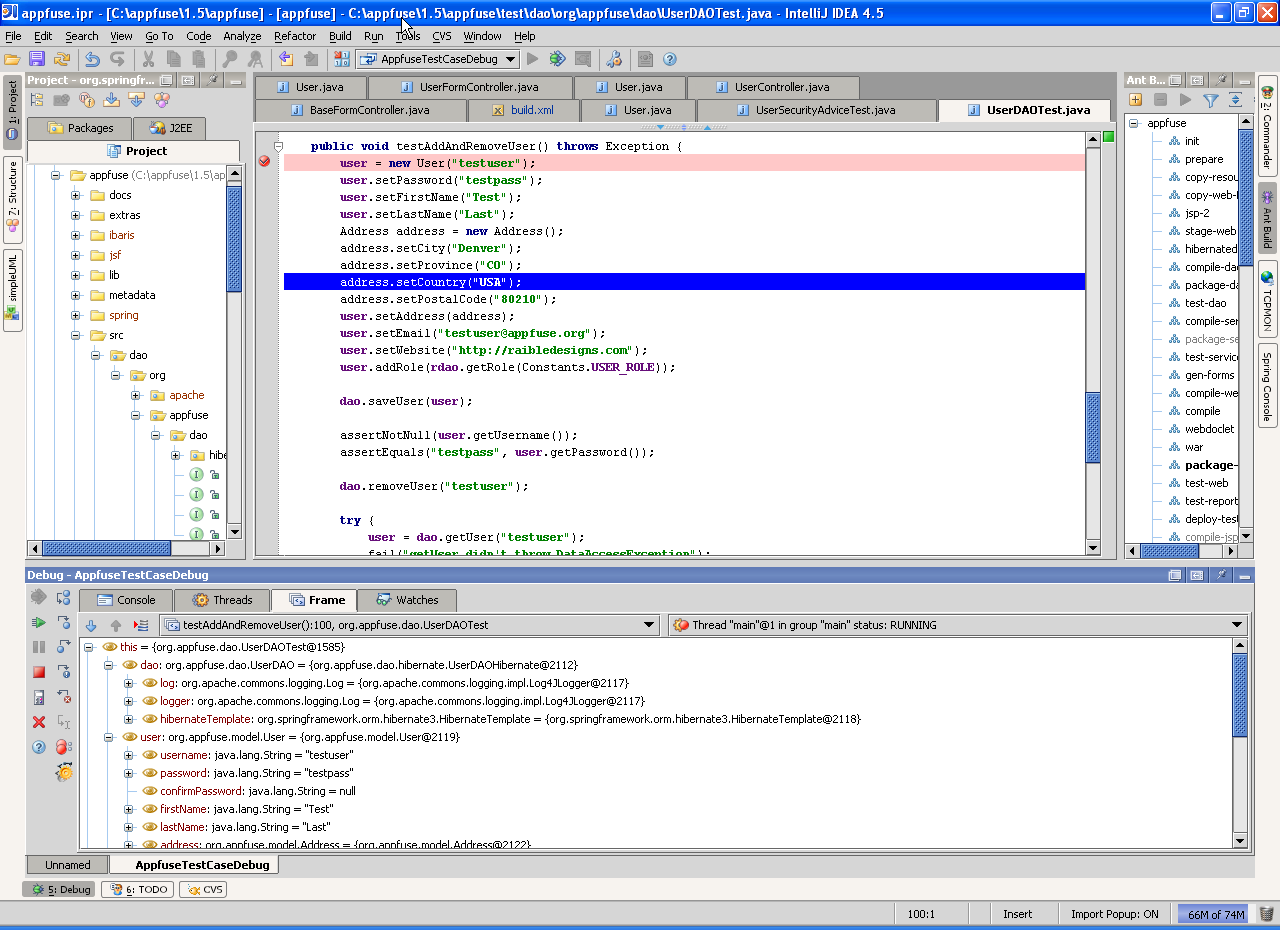
You can now step through your code, examine variables, evaluate expressions etc..
Running your web application using a debugger under Tomcat [#3]
The process for debugging your web application when running under tomcat is similar to that described above.Simply run ant -Dprojectname-debug=true start.tomcat. For this tutorial the command would be ant -Dfoo-debug=true start.tomcat.
You can set your breakpoint any where in your code like controllers, managers and DAO's. Tomcat also supports JSP debugging so you can also set breakpoint in your JSP code and troubleshoot those hard to track display issues.
Happy Debugging!!
Attachments:
| intellij-debugging.png |  |
115072 bytes |
| testcase-debug.png |  |
22008 bytes |
| intellij-setbreakpoint.png |  |
128268 bytes |
| intellij-connect.png |  |
26231 bytes |
|
Go to top
Edit this page
More info...
Attach file...
|
| This page last changed on 06-Nov-2006 13:52:59 MST by SanjivJivan. |