Developing with AngularJS - Part I: The Basics
There's many, many different introductions to AngularJS available on the internet. This article is not another introduction, but rather a story about my learning experience. It all started way back in January of this year. I was working as a UI Architecture Consultant at Taleo/Oracle, my client for the last 21 months. My gig there ended last month, but they agreed to let me publish a series of articles about the knowledge I gained.
Project Background
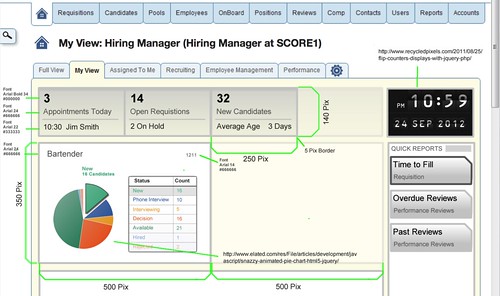
The Director of Product Management had been working on the concepts for a new project - codenamed "Visual MyView". Below is a mockup he created for our kickoff meeting on January 4th.
From his original email about the above mockup:
The intent here is that one of the columns has rows that have a similar width. The rows could be dragged and dropped into a different order – or potentially the two columns could also be reordered. The rows will basically be comprised of similar widgets. You can see in the mockup how the first two rows might look – and sample widgets. The widgets shown can be configured by the end user, as well as the order in which they are displayed. Other requirements given to us were the following.
- Row 1 is comprised of 'summary' widgets that are 'todo' items. Reviews needing done – approvals required – etc.
- Row 2 will be a graph row – having graphs and charts to display information – larger squares will build this row.
- Row 3's content was not determined yet.
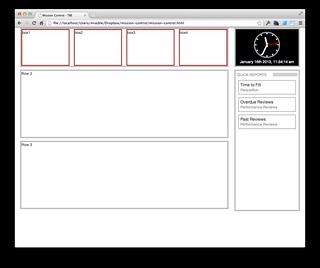
I started the initial layout with static HTML and CSS and had a wireframe to show by mid January.
By the end of January, we'd renamed the project to My Dashboard and had a working prototype using CoolClock and moment.js for the clock in the top right, AngularJS to display widget data, jQuery UI for drag-n-drop of rows and widgets, Bootstrap's Carousel for holding charts and Highcharts for rendering charts. For this prototype, we included 4 types of widgets:
- Summary
- Tasks
- Charts
- Reports
To create widgets, we had to decide on a common schema for them.
"id": 1, // not necessary for display, but likely needed if we modify and save preferences
"title": "Appointments Today",
"type": "summary", // others include: task, chart, report
"value": 3,
"description": "10:30 Jim Smith",
"events": "url", // this can have click events
"order": 1 // used to determine order
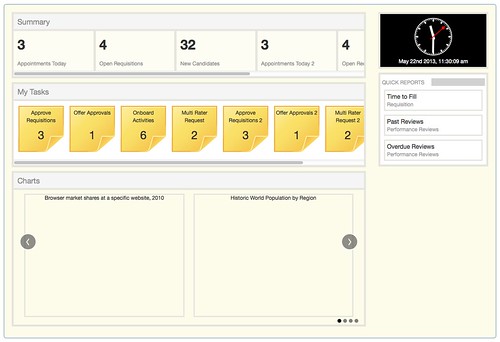
Below is a screenshot of our wireframe with some sample widgets.
Angular Basics
The decision to use AngularJS came early on in the project, after I read Tyler Renelle's Rant: Backbone, Angular, Meteor, Derby. To learn AngularJS, I briefly looked at its homepage documentation and played with some examples. Then I stumbled upon Misko Hevery and Igor Minar's AngularJS Presentation from Devoxx 2012. At that time, the video wasn't publicly available (it's free now), so I had to buy a Parley's subscription ($79). It was well worth the money because that one hour video greatly contributed to my understanding of how AngularJS works. Another resource I used frequently to figure out how to do things was John Lindquist's egghead.io.
To begin with, we wrote the JSON for a bunch of sample widgets and embedded them into the page as a widgetData JavaScript variable.
var widgetData = [
    {"id": 1, "title": "Appointments Today", "type": "summary", "value": 3, "description": "10:30 Jim Smith", "events": {"click": "alert('foo');"}, "order": 1},
    {"id": 12, "order": 2, "title": "Offer Approvals", "type": "task", "class": "sticky-note", "value": 1},
    {"id": 103, "title": "Browser market shares at a specific website, 2010", "order": 1, "type": "chart", "chartType": "pie",
         "tooltip": {"pointFormat": "{series.name}: <b>{point.percentage}%</b>", "percentageDecimals": 1}, "series": [
         {"type": "pie", "name": "Browser share", "data": [
             ["Firefox", 45.0],
             ["IE", 26.8],
             {"name": "Chrome", "y": 12.8, "sliced": true, "selected": true},
             ["Safari", 8.5],
             ["Opera", 6.2],
             ["Others", 0.7]
         ]}
    ]},
    ...
];
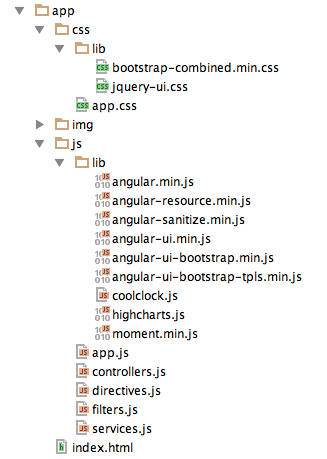
I used angular-seed to create the initial structure of the prototype, and continued using the same JavaScript file names when we moved it into the product I worked on. Since the application takes a while to login and render the My Dashboard page (when working remotely), I decided not to use the Karma testing framework that ships with Angular. Below is what our directory structure looked like for our prototype.
The JavaScript files in the "js" folder are the most important for Angular. The first file, app.js, loads the other files:
angular.module('dashboard', ['dashboard.filters', 'dashboard.services', 'dashboard.directives']);
The controllers.js file contains the Controllers (functions) that get the data and make it available to the page. Here's the code for our first controller:
'use strict';

/* Controllers */
function WidgetController($scope) {
    $scope.widgets = widgetData;
}
This puts the widgets in scope and then we were able to render them using Angular's ngRepeat directive and the following HTML:
<div ng-app="dashboard" class="dashboard">
    <div class="container-widgets" ng-controller="WidgetController" ng-cloak>
        <div class="row-fluid">
            <div class="span9">
                <ul class="widgets">
                    <li id="summary-bar">
                        <div class="heading">Summary</div>
                        <ul class="tiles">
                            <li class="span3" ng-repeat="widget in widgets | filter:{type: 'summary'} | orderBy: 'order'">
                                <h3 class="events">{{widget.value}}</h3>
                                <div class="title">{{widget.title}}</div>
                                <div class="desc">{{widget.description}}</div>
                            </li>
                        </ul>
                    </li>
                    <li id="task-bar">
                        <div class="heading">My Tasks</div>
                        <ul class="tasks">
                            <li class="task {{widget.class}}" ng-repeat="widget in widgets | filter: {type: 'task'} | orderBy: 'order'">
                                <div class="title events">{{widget.title}}</div>
                                <div class="value">{{widget.value}}</div>
                            </li>
                        </ul>
                    </li>
                    <li id="chart-bar">
                        <div class="heading">Charts</div>
                        <div id="chartCarousel" class="carousel slide">
                            <ol class="carousel-indicators">
                                <li data-target="#chartCarousel"
                                    ng-repeat="widget in widgets | filter: {type: 'chart'} | orderBy: 'order'"
                                    data-slide-to="{{$index}}" ng-class="{active: $index == 0}"></li>
                            </ol>
                            <div class="carousel-inner">
                                <div class="item chart"
                                     ng-repeat="widget in widgets | filter: {type: 'chart'} | orderBy: 'order'"
                                     ng-class="{active: $index == 0}">
                                    <chart class="widget" value="{{widget}}" type="{{widget.chartType}}"></chart>
                                </div>
                            </div>
                            <a class="left carousel-control" href="#chartCarousel" data-slide="prev">‹</a>
                            <a class="right carousel-control" href="#chartCarousel" data-slide="next">›</a>
                        </div>
                    </li>
                </ul>
            </div>
            <div class="span3">
                <!-- clock and reports -->
            </div>
    </div>
</div>
The beginning of this HTML shows how Angular is instantiated: ng-app matches the name defined in app.js, ng-controller instantiates the WidgetController and ng-cloak is used to hide everything until its processed.
<div ng-app="dashboard" class="dashboard">
    <div class="container-widgets" ng-controller="WidgetController" ng-cloak>
If you take a closer look at the way ng-repeat attributes, you'll see how filters are used to filter data. There's filter and orderBy filters that are built in and allow you to filter data. The filter filter allows you to query arrays by strings, objects and even functions. In the following code block, "task" widgets are filtered, ordered and displayed.
<li class="task {{widget.class}}" ng-repeat="widget in widgets | filter: {type: 'task'} | orderBy: 'order'">
    <div class="title events">{{widget.title}}</div>
    <div class="value">{{widget.value}}</div>
</li>
This was pretty straightforward, but we quickly noticed that if a widget had HTML in its title, it didn't display correctly (rendering the raw HTML). To process the HTML, we had to use the ngBindHtml directive (tip: directives are camelCase, but written with dashes in HTML).
<div class="title events" ng-bind-html="widget.title"></div>
After getting this to work, we noticed that some titles weren't fully rendered because they were hidden with overflow: hidden. We tried adding a tooltip with title="{{widget.title}}", but ran into the same issue. I sent an email to the AngularJS Google Group and received a solution: create an htmlTitle directive:
.directive('htmlTitle', function ($sanitize) {
    return {
        restrict: 'A',
        link: function (scope, element, attrs) {
            attrs.$observe('htmlTitle', function (title) {
                // convert &value; to HTML
                var html = angular.element('<div></div>').html($sanitize(title)).text();
                element.attr('title', html);
                element.html(html);
            });
        }
    }
})
Usage:
<div class="title events" ng-bind-html="widget.title" html-title="{{widget.title}}"></div>
Drag-and-Drop
To implement drag-and-drop functionality, I originally used jQuery UI's sortable. At the bottom of the page, the following code initialized sorting for the various lists:
$(document).ready(function() {
    $('.widgets').sortable({
        cursor: "move",
        handle: ".heading"
    }).disableSelection();
    $('.tiles,.tasks').sortable();
    var carousel = $('.carousel');
    $(carousel).carousel({
        interval: 0
    });
};
As you can see, it also initializes the carousel and stops it from cycling automatically.
Carousel Issues
The first problem I ran into with Bootstrap's Carousel was a strange error from Highcharts. If you look in the above HTML, you'll see there's a <chart> element. This is processed by a highcharts directive. When I tried to use this directive for Highcharts in a carousel, it results in the following error:
TypeError: Cannot read property 'length' of undefined at Object.ob.setMaxTicks
This seemed to be caused by the following css in Bootstrap:
.carousel-inner > .item { display: none }
When I added an override with "display: block" to my stylesheet, everything worked, but the charts were stacked instead of in a carousel. To fix this, I modified the directive to show/hide the "item" element so Highcharts was able to write to it. I also logged an issue for this.
if (element.parent().not(':visible')) {
    element.parent().show();
}
var chart = new Highcharts.Chart(newSettings);
element.parent().attr('style', '');
ngRepeat and Grouping
The last thing I accomplished in our end-of-January prototype was rendering 2 charts side-by-side. I got it working with plain HTML, created a "groupBy" filter for Angular and tried to get it to work with the following:
<div id="chartCarousel" class="carousel slide">
    <ol class="carousel-indicators">
        <li data-target="#chartCarousel" ng-repeat="widget in widgets | filter: {type: 'chart'} | groupBy"
            data-slide-to="{{$index}}" ng-class="{active: $index == 0}"></li>
    </ol>
    <div class="carousel-inner">
        <div class="item" ng-repeat="widget in widgets | filter: {type: 'chart'} | groupBy" ng-class="{active: $index == 0}">
            <div class="widget">{{widget[0].title}}</div>
            <div class="widget">{{widget[1].title}}</div>
        </div>
    </div>
    <a class="left carousel-control" href="#chartCarousel" data-slide="prev">‹</a>
    <a class="right carousel-control" href="#chartCarousel" data-slide="next">›</a>
</div>
This all worked like I expected it to in Chrome, but I the following errors showed in my console.
Error: 10 $digest() iterations reached. Aborting! Watchers fired in the last 5 iterations:
I sent an email to the Angular Google Group and received a link to a discussion where I found a "chunk" filter that solved the problem. This worked great, but I wanted to make it more responsive.
- If the user has a screen size big enough to fit 2 charts, show 2 charts and paginate by 2.
- If the user has a small screen size that only fits 1 chart, show 1 and paginate by 1.
To solve #1 and #2, I ended up rendering two different sections (with classes .oneup and .twoup) and displayed them based on screen size.
<li id="chart-bar">
    <div class="heading">Charts</div>
    <div id="chartCarousel1" class="carousel slide oneup" style="display: none">
        <ol class="carousel-indicators">
            <li data-target="#chartCarousel1"
                ng-repeat="widget in widgets | filter: {type: 'chart'} | orderBy: 'order'"
                data-slide-to="{{$index}}" ng-class="{active: $index == 0}"></li>
        </ol>
        <div class="carousel-inner">
            <div class="item chart"
                 ng-repeat="widget in widgets | filter: {type: 'chart'} | orderBy: 'order'"
                 ng-class="{active: $index == 0}">
                <chart class="widget" value="{{widget}}" type="{{widget.chartType}}"></chart>
            </div>
        </div>
        <a class="left carousel-control" href="#chartCarousel1" data-slide="prev">‹</a>
        <a class="right carousel-control" href="#chartCarousel1" data-slide="next">›</a>
    </div>
    <div id="chartCarousel2" class="carousel slide twoup" style="display: none">
        <ol class="carousel-indicators">
            <li data-target="#chartCarousel2"
                ng-repeat="widget in widgets | filter: {type: 'chart'} | chunk: 2 | orderBy: 'order'"
                data-slide-to="{{$index}}" ng-class="{active: $index == 0}"></li>
        </ol>
        <div class="carousel-inner">
            <div class="item chart"
                 ng-repeat="widget in widgets | filter: {type: 'chart'} | chunk: 2 | orderBy: 'order'"
                 ng-class="{active: $index == 0}">
                <chart class="widget" value="{{widget[0]}}" type="{{widget[0].chartType}}"></chart>
                <chart class="widget" value="{{widget[1]}}" type="{{widget[1].chartType}}"></chart>
            </div>
        </div>
        <a class="left carousel-control" href="#chartCarousel2" data-slide="prev">‹</a>
        <a class="right carousel-control" href="#chartCarousel2" data-slide="next">›</a>
    </div>
</li>
The JavaScript to show the correct number of charts is below:
var chartBar = $('#chart-bar');
function showCharts() {
    if (chartBar.width() < 960) {
        chartBar.find('.oneup').show();
        chartBar.find('.twoup').hide();
    } else {
        chartBar.find('.twoup').show();
        chartBar.find('.oneup').hide();
    }
}

$(document).ready(function () {
    showCharts();
});

$(window).resize(showCharts);
Summary
Even though I got everything to work for our initial prototype using Angular and jQuery, it didn't quite feel like I was taking full advantage of Angular's power. In particular, I learned that Angular UI Bootstrap had their own carousel and Angular UI had a sortable directive. My suspicions were confirmed when I read How do I "think in AngularJS" if I have a jQuery background?
In the next article, I'll talk about how I migrated to use Angular UI's carousel and sortable directives, as well as integrating dialogs.


Posted by huzzi on June 18, 2013 at 04:09 PM MDT #
Matt,
given your experience with both GWT and AngularJS how would you compare the web app development with both ?
What approach would you chose for developing of a new web app if you had a choice? And what would be your main decision criteria if the choice may vary?
Posted by Leo on June 18, 2013 at 08:05 PM MDT #
Hi Matt,
thank your for sharing your experiences with us.
From my experience I have found it quite difficult to integrate jQuery and AngularJS properly without messing up event handling and DOM manipulations.
I guess you will get into Angular directives in your next posts ?
However, I am wondering whether and to what extent jQuery still plays a vital role in your application.
Regards
Metin
Posted by Metin on June 18, 2013 at 09:44 PM MDT #
@Leo - I think GWT makes a lot of sense for Java developers, particularly those with a Swing background. AngularJS makes more sense for web developers (a.k.a. those that like to write JavaScript and CSS). However, I think Java devs will be attracted to Angular because of its emphasis on file structure, modularity and testability.
While I do enjoy writing with both frameworks, I still find that doing a straight-up Grails app gets me into the most productive flow. So I think there's still life in server-side frameworks because they've been so refined and perfected over the years.
@Metin - yes, I hope to touch on jQuery and AngularJS in my next article. jQuery still played a vital role in this particular application, even after refactoring to be more Angular-esque. In Part 4, I'll show how I ended up using jQuery for a lot of new design features we implemented. I could have written them as directives, but I found it faster to simply use jQuery.
Posted by Matt Raible on June 19, 2013 at 03:54 AM MDT #
I also think that Grails gives the best productivity for an experienced Java developer and this is my choice as well.
But Grails does not provide you rich UI out of the box. To achieve rich user experience one have to mingle GSPs with JQuery or use GWT or Angular or other similar alternative.
Posted by Leo on June 20, 2013 at 08:56 AM MDT #
Posted by Raible Designs on June 20, 2013 at 03:21 PM MDT #
Posted by Andreas Andreou on June 20, 2013 at 10:29 PM MDT #
Posted by Matt Raible on June 21, 2013 at 01:03 AM MDT #
Posted by Andreas Andreou on June 21, 2013 at 01:12 AM MDT #