

Developing Services with Apache Camel - Part IV: Load Testing and Monitoring
Welcome to the final article in a series on my experience developing services with Apache Camel. I learned how to implement CXF endpoints using its Java DSL, made sure everything worked with its testing framework and integrated Spring Boot for external configuration. For previous articles, please see the following:
- Part I: The Inspiration
- Part II: Creating and Testing Routes
- Part III: Integrating Spring 4 and Spring Boot
This article focuses on load testing and tools for monitoring application performance. In late July, I was asked to look into load testing the new Camel-based services I'd developed. My client's reason was simple: to make sure the new services were as fast as the old ones (powered by IBM Message Broker). I sent an email to the Camel users mailing list asking for advice on load testing.
I'm getting ready to put a Camel / CXF / Spring Boot application into production. Before I do, I want to load test and verify it has the same throughput as a the IBM Message Broker system it's replacing. Apparently, the old system can only do 6 concurrent connections because of remote database connectivity issues.
I'd like to write some tests that make simultaneous requests, with different data. Ideally, I could write them to point at the old system and find out when it falls over. Then I could point them at the new system and tune it accordingly. If I need to throttle because of remote connectivity issues, I'd like to know before we go to production. Does JMeter or any Camel-related testing tools allow for this?
In reply, I received suggestions for Apache's ab tool and Gatling. I'd heard of Gatling before, and decided to try it.
Gatling
 I don't remember where I first heard of Gatling, but I knew it had a Scala DSL and used
Akka under the covers.
I generated a new project using a Maven
archetype and went to work developing my first test.
My approach involved three steps:
I don't remember where I first heard of Gatling, but I knew it had a Scala DSL and used
Akka under the covers.
I generated a new project using a Maven
archetype and went to work developing my first test.
My approach involved three steps:
- Write tests to run against current system. Find the number of concurrent requests that make it fall over.
- Run tests against new system and tune accordingly.
- Throttle requests if there are remote connectivity issues with 3rd parties. If I needed to throttle requests, I was planning to use Camel's Throttler.
To develop the first test, I started with Gatling's
Recorder. I set it to listen on port 8000, changed my DrugServiceITest to use the same port and
ran the integration test. This was a great way to get started because it recorded my requests as XML files, and used
clean and concise code.
I ended up creating a parent class for all simulations and named it AbstractSimulation. This was handy
because it allowed me to pass in parameters for all the values I wanted to change.
import io.gatling.core.scenario.Simulation
import io.gatling.http.Predef._

/**
 * Base Simulation class that allows passing in parameters.
 */
class AbstractSimulation extends Simulation {

  val host = System.getProperty("host", "localhost:8080")
  val serviceType = System.getProperty("service", "modern")
  val nbUsers = Integer.getInteger("users", 10).toInt
  val rampRate = java.lang.Long.getLong("ramp", 30L).toLong

  val httpProtocol = http
    .baseURL("http://" + host)
    .acceptHeader("text/html,application/xhtml+xml,application/xml;q=0.9,*/*;q=0.8")
    .doNotTrackHeader("1")
    .acceptLanguageHeader("en-US,en;q=0.5")
    .acceptEncodingHeader("gzip, deflate")
    .userAgentHeader("Gatling 2.0")

  val headers = Map(
    """Cache-Control""" -> """no-cache""",
    """Content-Type""" -> """application/soap+xml; charset=UTF-8""",
    """Pragma""" -> """no-cache""")
}
The DrugServiceSimulation.scala class posts a SOAP request over HTTP.
import io.gatling.core.Predef._
import io.gatling.http.Predef._

import scala.concurrent.duration._

class DrugServiceSimulation extends AbstractSimulation {

  val service = if ("modern".equals(serviceType)) "/api/drugs" else "/axis2/services/DrugService"

  val scn = scenario("Drug Service :: findGpiByNdc")
    .exec(http(host)
    .post(service)
    .headers(headers)
    .body(RawFileBody("DrugServiceSimulation_request.xml")))

  setUp(scn.inject(ramp(nbUsers users) over (rampRate seconds))).protocols(httpProtocol)
}
To run tests against the legacy drug service with 100 users over 60 seconds, I used the following command:
mvn test -Dhost=legacy.server:7802 -Dservice=legacy -Dusers=100 -Dramp=60
The service property's default is "modern" and determines the service's URL. To run against the local drug service with 100 users over 30 seconds, I could rely on more defaults.
mvn test -Dusers=100
The name of the simulation to run is configured in pom.xml:
<plugin>
    <groupId>io.gatling</groupId>
    <artifactId>gatling-maven-plugin</artifactId>
    <version>${gatling.version}</version>
    <configuration>
        <simulationsFolder>src/test/scala</simulationsFolder>
        <simulationClass>com.company.app.${service.name}Simulation</simulationClass>
    </configuration>
    <executions>
        <execution>
            <phase>test</phase>
            <goals>
                <goal>execute</goal>
            </goals>
        </execution>
    </executions>
</plugin>
When the simulations were done running, the console displayed a link to some pretty snazzy HTML reports. I ran simulations until things started falling over on the legacy server. That happened at around 400 requests per second (rps). When I ran them against a local instance on my fully-loaded 2013 MacBook Pro, errors started flying at 4000/rps while 3000/rps performed just fine.
Jenkins
I configured simulations to run in Jenkins with the Gatling Plugin. It's a neat plugin that allows you to record and compare results over time. After initial setup, I found I didn't use it much. Instead, I created a Google Doc with my findings and created screenshots of results so my client had it in an easy-to-read format.
Data Feeders
I knew the results of the simulations were likely skewed, since the same request was used for all users. I researched how to make dynamic requests with Gatling and found Feeders. Using a JDBC Feeder I was able make all the requests contain unique data for each user.
I added a feeder to DrugServiceSimulation, added it to the scenario and changed to use an ELFileBody so
the feeder would substitute a ${NDC} variable in the XML file.
val feeder = jdbcFeeder("jdbc:db2://server:50002/database", "username", "password",
    "SELECT NDC FROM GENERICS")

val scn = scenario("Drug Service")
        .feed(feeder)
        .exec(http(host)
        .post(service)
        .headers(headers)
        .body(ELFileBody("DrugServiceSimulation_request.xml")))
I deployed the new services to a test server and ran simulations with 100 and 1000 users.
- 100 users over 30 seconds
- Neither service had any failures with 100 users. The max response time for the legacy service was 389 ms, while the new service was 172 ms. The mean response time was lower for the legacy services: 89 ms vs. 96 ms.
- 1000 users over 60 seconds
- When simulating 1000 users against the legacy services, 50% of the requests failed and the average response time was over 40 seconds. Against the new services, all requests succeeded and the mean response time was 100ms.
I was pumped to see the new services didn't need any additional performance enhancements. These results were enough to convince my client that Apache Camel was going to be a performant replacement for IBM Message Broker.
I wrote more simulations for another service I developed. In doing so, I discovered I missed implementing a couple custom routes for some clients. The dynamic feeders made me stumble onto this because they executed simulations for all clients. After developing the routes, the dynamic data helped me uncover a few more bugs. Using real data to load test with was very helpful in figuring out the edge-cases our routes needed to handle.
Next, I started configuring logging for our new Camel services.
Logging with Log4j2
Log4j 2.0 had just been released and my experience integrating it in AppFuse motivated me to use it for this project. I configured Spring to use Log4j 2.0 by specifying the following dependencies. Note: Spring Boot 1.2+ has support for Log4j2.
<log4j.version>2.0</log4j.version>
...

<!-- logging -->
<dependency>
    <groupId>org.slf4j</groupId>
    <artifactId>slf4j-api</artifactId>
    <version>1.7.7</version>
</dependency>
<!-- Necessary to configure Spring logging with log4j2.xml -->
<dependency>
    <groupId>org.apache.logging.log4j</groupId>
    <artifactId>log4j-jcl</artifactId>
    <version>${log4j.version}</version>
</dependency>
<dependency>
    <groupId>org.apache.logging.log4j</groupId>
    <artifactId>log4j-slf4j-impl</artifactId>
    <version>${log4j.version}</version>
</dependency>
<dependency>
    <groupId>org.apache.logging.log4j</groupId>
    <artifactId>log4j-web</artifactId>
    <version>${log4j.version}</version>
</dependency>
I created a src/main/resources/log4j2.xml file and configured a general log, as well as one for each
route. I configured
each route to use "log:com.company.app.route.input" and "log:com.company.app.route.output" instead of "log:input"
and "log:output". This
allowed the log-file-per-route configuration you see below.
<?xml version="1.0" encoding="UTF-8"?>
<Configuration>
    <Properties>
        <Property name="fileLogDir">/var/log/app-name</Property>
        <Property name="fileLogPattern">%d %p %c: %m%n</Property>
        <Property name="fileLogTriggerSize">1 MB</Property>
        <Property name="fileLogRolloverMax">10</Property>
    </Properties>
    <Appenders>
        <Console name="Console" target="SYSTEM_OUT">
            <PatternLayout pattern="%d [%-15.15t] %-5p %-30.30c{1} %m%n"/>
        </Console>
        <RollingFile name="File" fileName="${fileLogDir}/all.log"
                         filePattern="${fileLogDir}/all-%d{yyyy-MM-dd}-%i.log">
            <PatternLayout pattern="${fileLogPattern}"/>
            <Policies>
                <SizeBasedTriggeringPolicy size="${fileLogTriggerSize}"/>
            </Policies>
            <DefaultRolloverStrategy max="${fileLogRolloverMax}"/>
        </RollingFile>
        <RollingFile name="DrugServiceFile" fileName="${fileLogDir}/drug-service.log"
                         filePattern="${fileLogDir}/drug-service-%d{yyyy-MM-dd}-%i.log">
            <PatternLayout pattern="${fileLogPattern}"/>
            <Policies>
                <SizeBasedTriggeringPolicy size="${fileLogTriggerSize}"/>
            </Policies>
            <DefaultRolloverStrategy max="${fileLogRolloverMax}"/>
        </RollingFile>
        <!-- Add a RollingFile for each route -->
    </Appenders>

    <Loggers>
        <Logger name="org.apache.camel" level="info"/>
        <Logger name="org.springframework" level="error"/>
        <Logger name="com.company.app" level="info"/>

        <Root level="error">
            <AppenderRef ref="Console"/>
            <AppenderRef ref="File"/>
        </Root>

        <Logger name="com.company.app.drugs" level="debug">
            <AppenderRef ref="DrugServiceFile"/>
        </Logger>
        <!-- Add a Logger for each route -->
    </Loggers>
</Configuration>
I did run into some issues with this configuration:
- The
/var/log/app-namedirectory has to exist or there's a stacktrace on startup and no logs are written. - When deploy from Jenkins, I ran into permissions issues between deploys. To fix this, I chowned the
directory before restarting Tomcat.
chown -R tomcat /var/log/app-name
/etc/init.d/tomcat start
Monitoring
![]() While I was configuring the new services on our test server, I also installed hawtio at
/console.
I had previously configured it to run in Tomcat when running "mvn tomcat7:run":
While I was configuring the new services on our test server, I also installed hawtio at
/console.
I had previously configured it to run in Tomcat when running "mvn tomcat7:run":
<plugin>
    <groupId>org.apache.tomcat.maven</groupId>
    <artifactId>tomcat7-maven-plugin</artifactId>
    <version>2.2</version>
    <configuration>
        <path>/</path>
        <webapps>
            <webapp>
                <contextPath>/console</contextPath>
                <groupId>io.hawt</groupId>
                <artifactId>hawtio-web</artifactId>
                <version>1.4.19</version>
                <type>war</type>
                <asWebapp>true</asWebapp>
            </webapp>
        </webapps>
    </configuration>
    ...
</plugin>
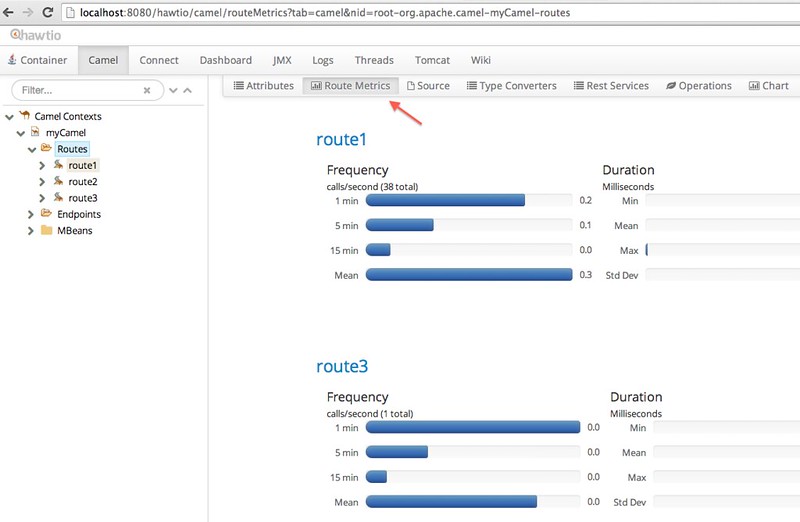
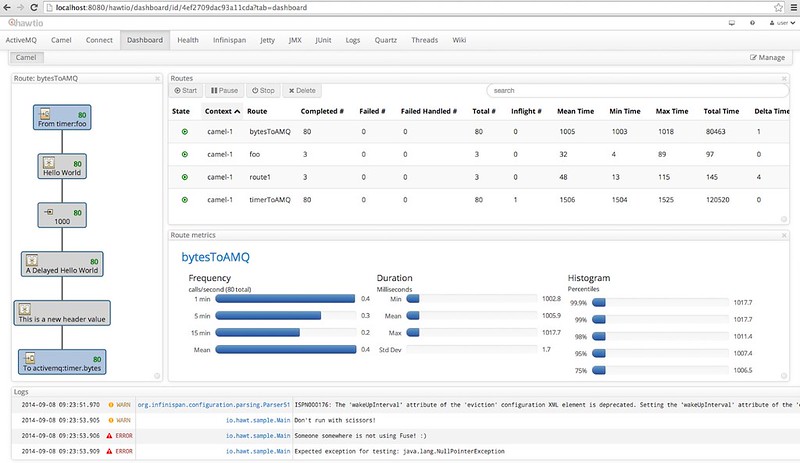
hawtio has a Camel plugin that's pretty slick. It shows all your routes and their runtime metrics; you can even edit the source code for routes. Even though I used a Java DSL, my routes are only editable as XML in hawtio. Claus Ibsen has a good post on Camel's new Metrics Component. I'd like to learn how to build a custom dashboard for hawtio - Claus's example looks pretty nice.
The Spring Boot plugin for hawtio is not nearly as graphic intensive. Instead, it just displays metrics and their values in a table format.

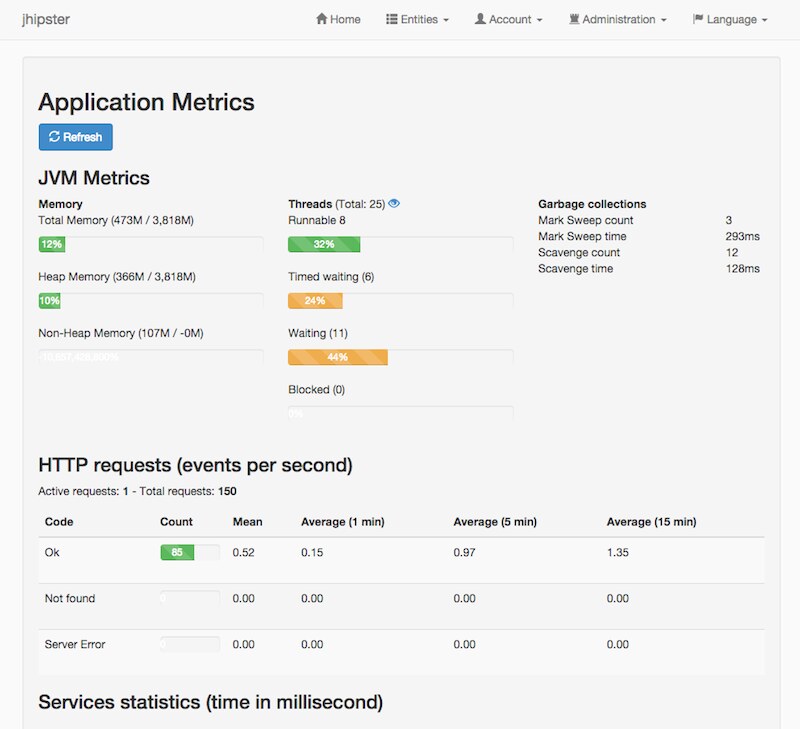
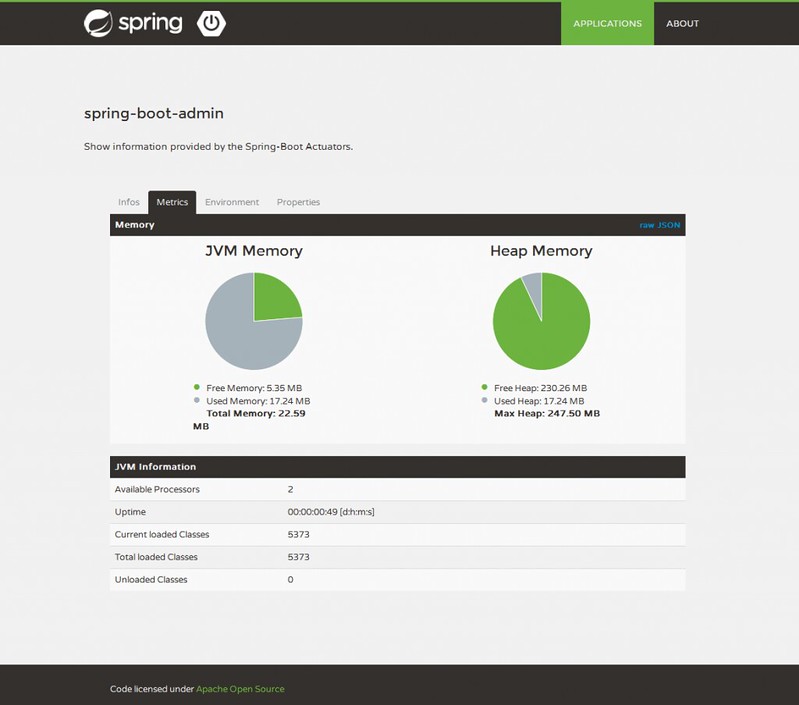
There's some good-looking Spring Boot Admin UIs out there, notably JHipster's and the one in spring-boot-admin. I hope the hawtio Spring Boot plugin gets prettier as it matures.
I wanted more than just monitoring, I wanted alerts when something went wrong. For that, I installed New Relic on our Tomcat server. I'm fond of getting the Monday reports, but they only showed activity when I was load testing.
I believe all these monitoring tools will be very useful once the app is in production. My last day with this client is next Friday, October 24. I'm trying to finish up the last couple of services this week and next. With any luck, their IBM Message Broker will be replaced this year.
Summary
This article shows how to use Gatling to load test a SOAP service and how to configure Log4j2 with Spring Boot. It also shows how hawtio can help monitor and configure a Camel application. I hope you enjoyed reading this series on what I learned about developing with Camel over the past several months. If you have stories about your experience with Camel (or similar integration frameworks), Gatling, hawtio or New Relic, I'd love to hear them.
It's been a great experience and I look forward to developing solid apps, built on open source, for my next client. I'd like to get back into HTML5, AngularJS and mobile development. I've had a good time with Spring Boot and JHipster this year and hope to use them again. I find myself using Java 8 more and more; my ideal next project would embrace it as a baseline. As for Scala and Groovy, I'm still a big fan and believe I can develop great apps with them.
If you're looking for a UI/API Architect that can help accelerate your projects, please let me know! You can learn more about my extensive experience from my LinkedIn profile.
Hi,
very nice article, thank you for sharing. Currently I'm developing a solution where many routes will be deployed and I'm still searching a solution for making the Apache Camel scalable. Have you taken this into consideration as well? I mean, do you deploy just more standalone instance of apache camel with the same routes?
Best regards,
Dimitrij
Posted by dimitrij on December 20, 2014 at 07:43 PM MST #
Posted by Matt Raible on December 20, 2014 at 07:59 PM MST #